
In real world production systems, we’re always forced to concede that systems inevitably fail and we always should have our tooling ready to help us detect and fix issues as soon as they occur. We have to do this before minor issues start cascading to broader issues that start impacting our customers or our bottom lines. Having reliable log data and the ability to parse through and inspect thousands/millions of log lines in near real time can make or break our troubleshooting efforts.
For web applications that are delivered on the Akamai platform, a lot of the information for troubleshooting and, more generally, understanding traffic patterns and trends is available for us on the Luna portal. However, if we need a slightly more granular analysis of the data or a closer-to-real-time feel of the data, Akamai’s CloudMonitor feature is the way to go. CloudMonitor does have native support for enterrpise scale analysis tools like Splunk and SumoLogic, but if you’re looking for an easy and relatively cheap way to start looking at the data, Amazon Web Services (AWS) has a few services that’ll help you get going.
In this blog post, I’ll try to focus more on the data ingest part of this equation and less on the Akamai property configs needed to set this up. Akamai professional services and/or the CloudMonitor product documentation can help with the latter.
Integration Approach
There are a few distinct services that I had used to scale up my implementation to a state that I felt comfortable. Some of these may become more or less pertinent for your use case depending on factors like traffic to your site (the more visitors you have, the more log lines that need to flow over), data retention needs etc.
API Gateway:
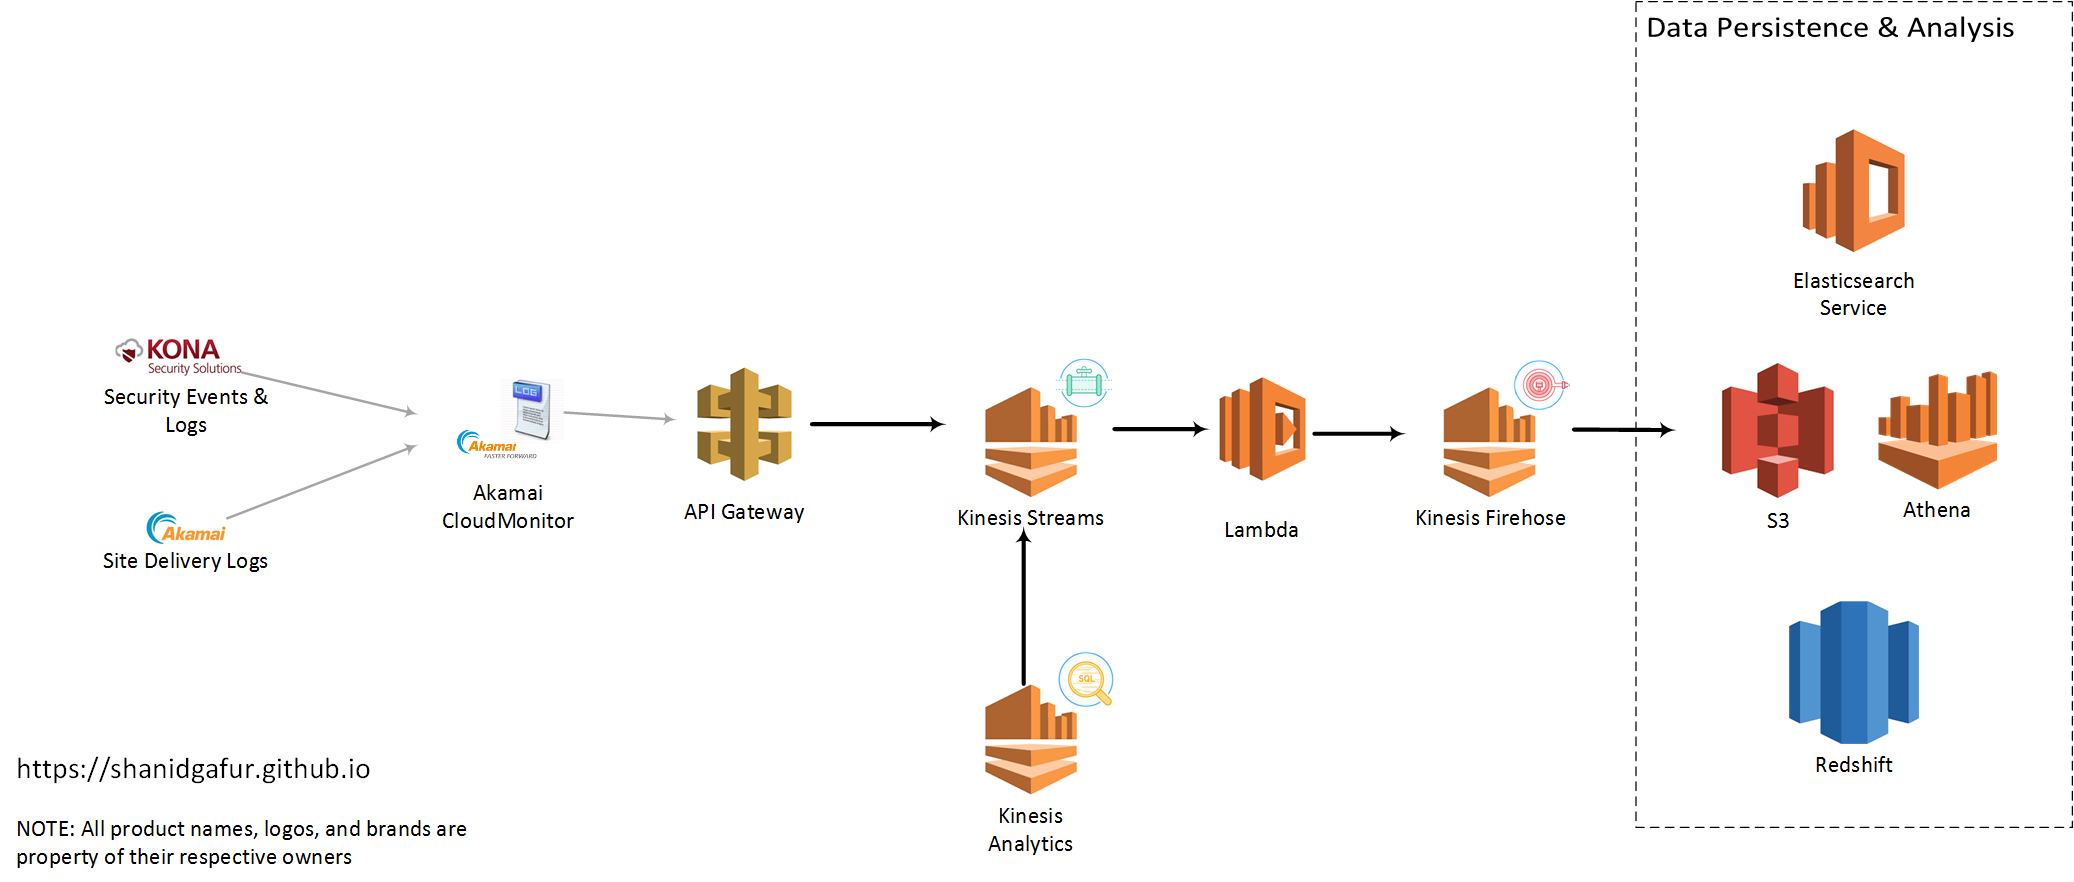
The configuration for CloudMonitor delivery config in Akamai requires specifies am API end point that accepts HTTP POST requests. AWS API Gateway gives us an easy way to setup such an end point for CloudMonitor. For high traffic sites, expect to have a significant hits per second ratio. So as to not introduce any latency to the end point, it is very important for the API to do as minimal as possible to capture the payload and respond back with a 200 OK status code. The easiest way to accomplish this is to have the API write the payload as such to queue or topic based messaging middleware. This is where AWS Kinesis Streams comes in. API Gateway can be used to map the incoming request to Kinesis Streams (or any other AWS service, for that matter) relatively easily.
In order to map the incoming payload to a Kinesis message, create a body mapping template for Content-Type application/json with the following configuration
{
    "StreamName": "CloudMonitorStream",
    "Data" : "$util.base64Encode($input.body)",
    "PartitionKey" : "$context.identity.sourceIp"
}
In plain english, this configuration takes the HTTP POST body, base-64 encodes it and writes to a Kinesis Stream called CloudMonitorStream. Additionally, it uses the IP address of the client calling it as the partition key for sharding the data into of many partitions of the CloudMonitorStream.
Kinesis Streams: AWS Kinesis Streams gives us the ability to ingest large amounts of data and durably store that data while process the payload. The only real configuration needed for the Stream is to define the number of shards or partitions for the data. From the AWS documentation,
number_of_shards = max(incoming_write_bandwidth_in_KB/1000, outgoing_read_bandwidth_in_KB/2000)

where
incoming_write_bandwidth_in_KB = average_data_size_in_KB x records_per_second
and
outgoing_read_bandwidth_in_KB = incoming_write_bandwidth_in_KB x number_of_consumers
Lambda: Now that we’ve gotten to a state where we can accept the payload and temporarily store it for processing, it’s time for the actual data processing to begin. This is where AWS Lambda comes into play. Lambda, if you haven’t used it yet, is the AWS implementation of the broader trend usually refered to as serverless computing. Lambda allows us to write code in our language of choice (currently support Java, Python, node.js and C#), and have that code get triggered automatically in response to events raised outside of that code.
The code that get triggered can be used to do pretty much anything that that the runtime language supports. For this use case, I used Lambda to strip out some characters in the payload that were making life difficult downstream in ElasticSearch. I also modified the latitutde and longitude data in my CloudMonitor payload to look more like an ElasticSearch geo_point data type. Code snippet below to give you an idea of what I mean by this.
json_input = json.loads(input)
    try:
        lat = float(json_input['geo']['lat'])
        lon  = float(json_input['geo']['long'])
    except:
        lat = 0.00
        lon = 0.00
        pass
    geolocation = {"lat":lat,"lon": lon}
    json_input['geo']['location'] = geolocation
    output = json.dumps(json_input)
This bit of code changes out my CloudMonitor payload from
"geo": {
    "country": "US",
    "region": "IL",
    "city": "SPRINGFIELD",
    "lat": "39.7998",
    "long": "-89.6494"
}
to this
"geo": {
       "city": "SPRINGFIELD",
       "country": "US",
       "region": "IL",
       "long": "-89.6494",
       "location": {
           "lat": 39.7998,
           "lon": -89.6494
       },
       "lat": "39.7998"
   }
Once we have the data payload formatted and modified, we can write out this formatted json object into my Kinesis Firehose instance.
Kinesis Firehose: Although, they’re both branded “Kinesis” by AWS, the function of Kinesis Firehose is slightly different from the function of Kinesis Streams. The objective with using Kinesis Firehose is to transfer data from a source to a defined data sink like S3, ElasticSearch Service or Redshift. Firehose helps manage logic for retry, failures etc for the data that is flowing through it. Configuration for Firehose instances are quite painless and very easy to manage.
With the help of Firehose, we should be able to write data into one of the supported data sinks where we can subsequently analyze and visualize the data from CloudMonitor to our hearts content!
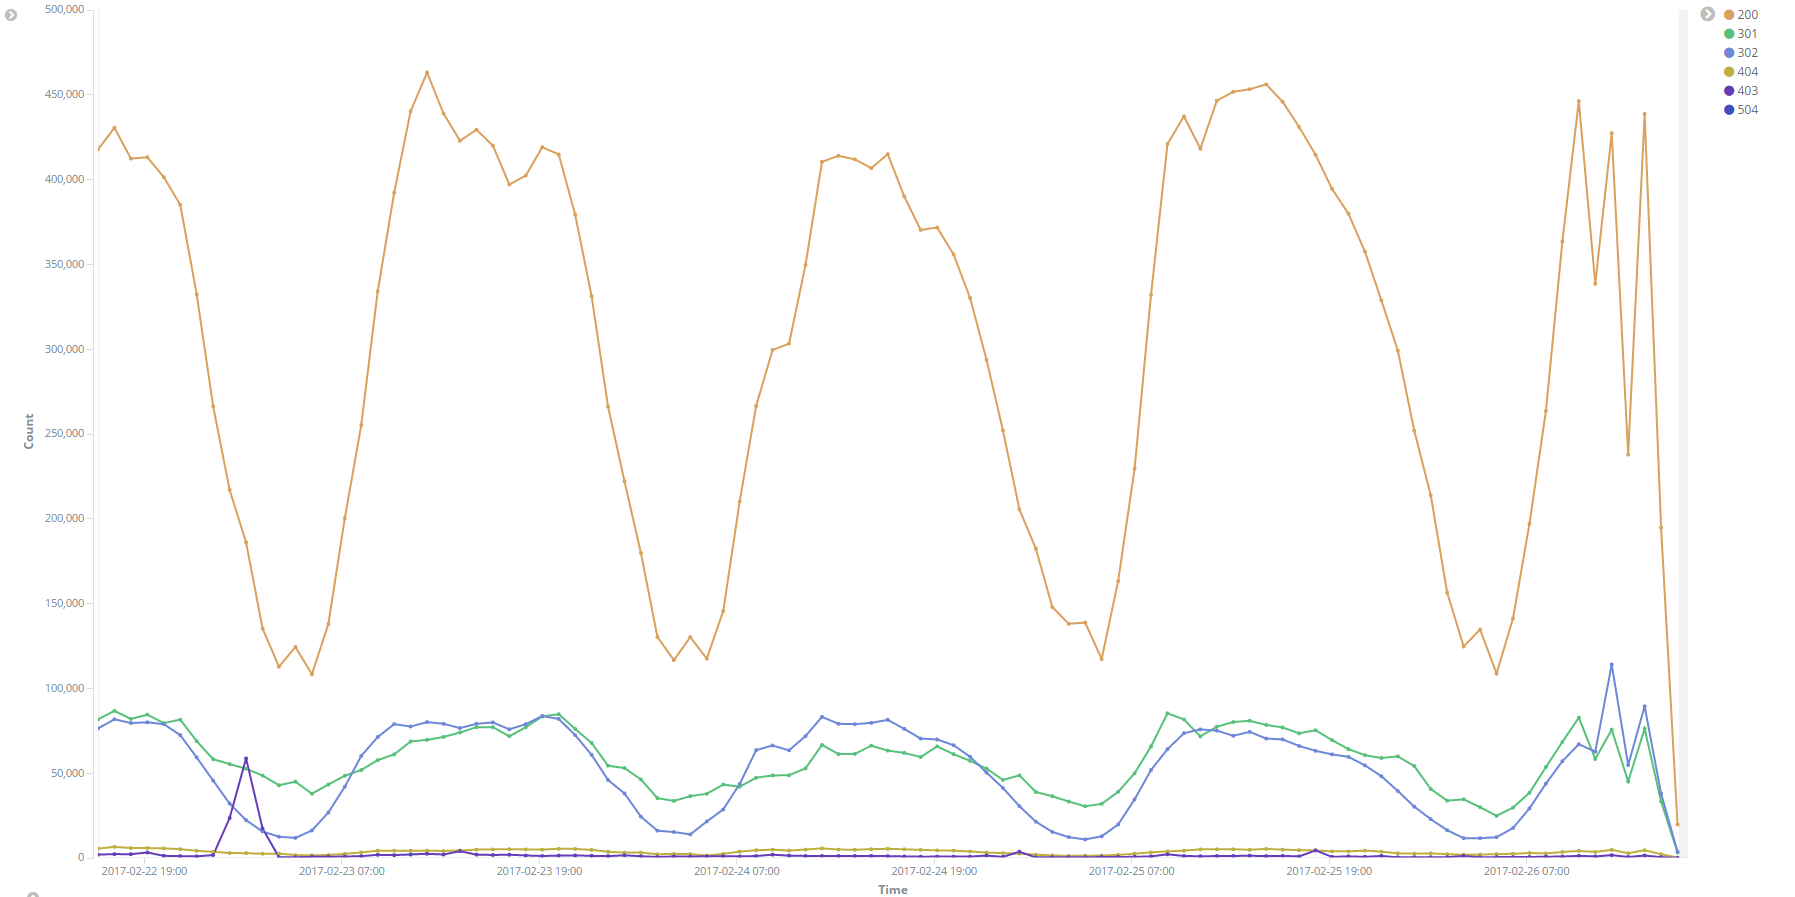
Image: HTTP Response codes over time
Conclusion
By putting together the AWS services highlighted above, we’ve created a solution to ingest large volumes of log data from Akamai CloudMonitor to a data store that we can use for data discovery and analysis. While this blog post talks about this approach in the context of Akamai, these AWS services could really be used for ingest and processing of any large stream of data.
If you need additional details about any aspect of this integration, or if you have alternate approaches that you’d like to share, please post a comment below.