
about:software
This blog talks about software and systems integration. No developers were harmed in the creation of this blog.. well, mostly, anyway..
This blog talks about software and systems integration. No developers were harmed in the creation of this blog.. well, mostly, anyway..
This blog post talks about using Terraform workspaces as a mechanism to maintain consistent environments across multiple cloud regions. While the examples in the post are AWS-centric, the concepts highlighted here are really cloud agnostic.
resource "aws_s3_bucket" "my-s3-bucket" {
  bucket = "my-s3-bucket"
  acl    = "private"

  tags {
    Name        = "my-s3-bucket"
    Environment = "dev"
  }
}
{
    "type": "aws_s3_bucket",
    "primary": {
      "id": "my-s3-bucket",
      "attributes": {
          "acceleration_status": "",
          "acl": "private",
          "arn": "arn:aws:s3:::my-s3-bucket",
          "bucket": "my-s3-bucket",
          "cors_rule.#": "0",
          "force_destroy": "false",
          "id": "my-s3-bucket",
          "logging.#": "0",
          "region": "us-east-1",
          "replication_configuration.#": "0",
          "server_side_encryption_configuration.#": "0",
          "tags.%": "2",
          "tags.Environment": "dev",
          "tags.Name": "my-s3-bucket",
          "versioning.#": "1",
          "versioning.0.enabled": "false",
          "versioning.0.mfa_delete": "false"
      },
    "meta": {},
    "tainted": false
    },
  "deposed": [],
  "provider": "provider.aws.east1"
}
terraform apply using the same configuration separately for “dev”, “qa”, and “prod” environments. This same capability can also be used to manage multi-region deployments.
provider "aws" {
 region = "${terraform.workspace}"
}
terraform init will no longer work in the default workspace, since (as you may have guessed) there is no default region for AWS. However, if we were to create a workspace corresponding to a valid AWS region and then terraform init, that would work
    shanid:~/dev$ terraform workspace new us-east-1

    Created and switched to workspace "us-east-1"!

    You are now on a new, empty workspace. Workspaces isolate their state,
    so if you run "terraform plan" Terraform will not see any existing state
    for this configuration.
terraform init, terraform plan and terraform apply as usual.
Once we have provisioned our resources in this region, create a workspace for a second region and re-run the terraform in that workspace to create the exact same set of AWS resources in that region.
    shanid:~/dev$ terraform workspace new us-west-2

    Created and switched to workspace "us-west-2"!

    You are now on a new, empty workspace. Workspaces isolate their state,
    so if you run "terraform plan" Terraform will not see any existing state
    for this configuration.
resource "aws_iam_role" "lambda_role" {
 name     = "my_lambda_role"
 assume_role_policy = <<EOF
{
 "Version": "2012-10-17",
 "Statement": [
   {
     "Sid": "",
     "Effect": "Allow",
     "Principal": {
       "Service": "lambda.amazonaws.com"
     },
     "Action": "sts:AssumeRole"
   }
 ]
}
EOF
}
my_lambda_role already exists. The easiest way to solve for this, is to include the region/workspace in the name of the resource being created. For example, the following config will create distinctly named IAM roles
resource "aws_iam_role" "lambda_role" {
 name     = "my_lambda_role_${terraform.workspace}"
 assume_role_policy = <<EOF
{
 "Version": "2012-10-17",
 "Statement": [
   {
     "Sid": "",
     "Effect": "Allow",
     "Principal": {
       "Service": "lambda.amazonaws.com"
     },
     "Action": "sts:AssumeRole"
   }
 ]
}
EOF
}
my_lambda_role_us-east-1 role in us-east-1 and a my_lambda_role_us-west-2 role in us-west-2. And we have maintained our objective of a single configuration that can be deployed seamlessly into multiple regions.
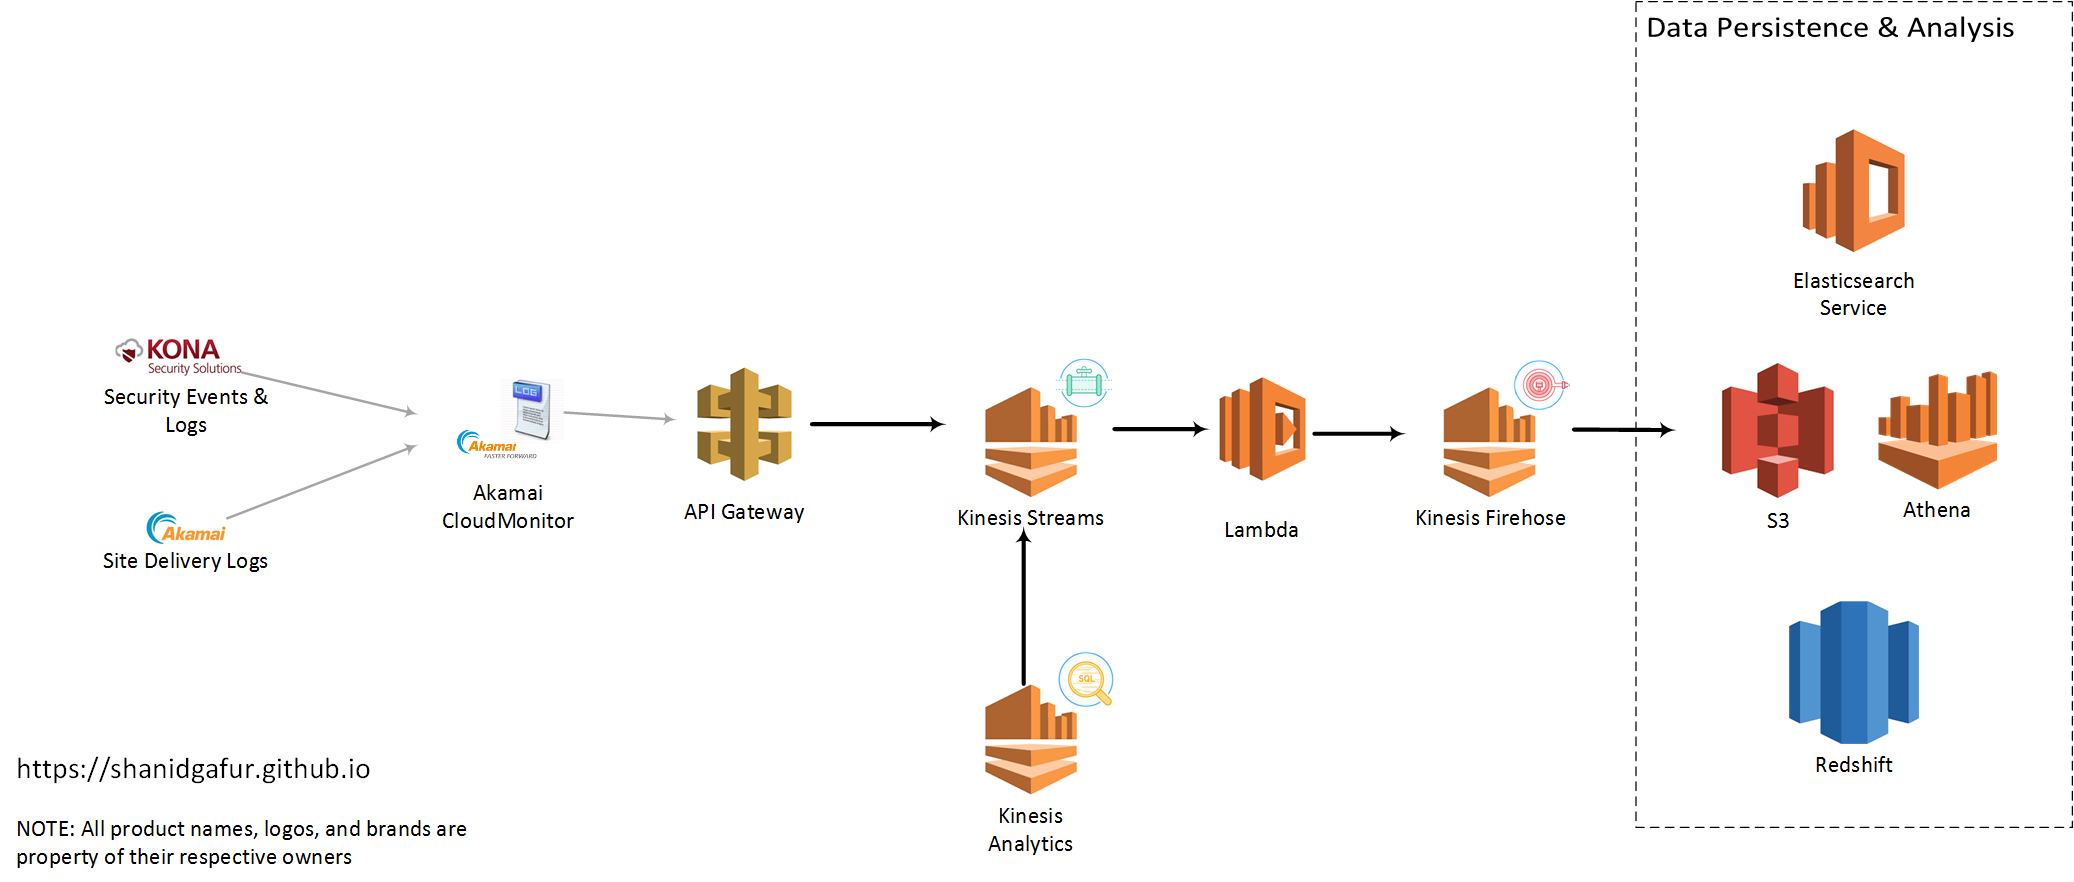
In real world production systems, we’re always forced to concede that systems inevitably fail and we always should have our tooling ready to help us detect and fix issues as soon as they occur. We have to do this before minor issues start cascading to broader issues that start impacting our customers or our bottom lines. Having reliable log data and the ability to parse through and inspect thousands/millions of log lines in near real time can make or break our troubleshooting efforts. For web applications that are delivered on the Akamai platform, a lot of the information for troubleshooting and, more generally, understanding traffic patterns and trends is available for us on the Luna portal. However, if we need a slightly more granular analysis of the data or a closer-to-real-time feel of the data, Akamai’s CloudMonitor feature is the way to go. CloudMonitor does have native support for enterrpise scale analysis tools like Splunk and SumoLogic, but if you’re looking for an easy and relatively cheap way to start looking at the data, Amazon Web Services (AWS) has a few services that’ll help you get going. In this blog post, I’ll try to focus more on the data ingest part of this equation and less on the Akamai property configs needed to set this up. Akamai professional services and/or the CloudMonitor product documentation can help with the latter.
 There are a few distinct services that I had used to scale up my implementation to a state that I felt comfortable. Some of these may become more or less pertinent for your use case depending on factors like traffic to your site (the more visitors you have, the more log lines that need to flow over), data retention needs etc.
API Gateway:
The configuration for CloudMonitor delivery config in Akamai requires specifies am API end point that accepts
There are a few distinct services that I had used to scale up my implementation to a state that I felt comfortable. Some of these may become more or less pertinent for your use case depending on factors like traffic to your site (the more visitors you have, the more log lines that need to flow over), data retention needs etc.
API Gateway:
The configuration for CloudMonitor delivery config in Akamai requires specifies am API end point that accepts HTTP POST requests. AWS API Gateway gives us an easy way to setup such an end point for CloudMonitor. For high traffic sites, expect to have a significant hits per second ratio. So as to not introduce any latency to the end point, it is very important for the API to do as minimal as possible to capture the payload and respond back with a 200 OK status code. The easiest way to accomplish this is to have the API write the payload as such to queue or topic based messaging middleware. This is where AWS Kinesis Streams comes in. API Gateway can be used to map the incoming request to Kinesis Streams (or any other AWS service, for that matter) relatively easily.
In order to map the incoming payload to a Kinesis message, create a body mapping template for Content-Type application/json with the following configuration
{
    "StreamName": "CloudMonitorStream",
    "Data" : "$util.base64Encode($input.body)",
    "PartitionKey" : "$context.identity.sourceIp"
}HTTP POST body, base-64 encodes it and writes to a Kinesis Stream called CloudMonitorStream. Additionally, it uses the IP address of the client calling it as the partition key for sharding the data into of many partitions of the CloudMonitorStream.
Kinesis Streams:
AWS Kinesis Streams gives us the ability to ingest large amounts of data and durably store that data while process the payload. The only real configuration needed for the Stream is to define the number of shards or partitions for the data. From the AWS documentation,
number_of_shards = max(incoming_write_bandwidth_in_KB/1000, outgoing_read_bandwidth_in_KB/2000)

where
incoming_write_bandwidth_in_KB = average_data_size_in_KB x records_per_second
and
outgoing_read_bandwidth_in_KB = incoming_write_bandwidth_in_KB x number_of_consumersgeo_point data type. Code snippet below to give you an idea of what I mean by this.
json_input = json.loads(input)
    try:
        lat = float(json_input['geo']['lat'])
        lon  = float(json_input['geo']['long'])
    except:
        lat = 0.00
        lon = 0.00
        pass
    geolocation = {"lat":lat,"lon": lon}
    json_input['geo']['location'] = geolocation
output = json.dumps(json_input)"geo": {
"country": "US",
"region": "IL",
"city": "SPRINGFIELD",
"lat": "39.7998",
"long": "-89.6494"
}"geo": {
"city": "SPRINGFIELD",
"country": "US",
"region": "IL",
"long": "-89.6494",
"location": {
"lat": 39.7998,
"lon": -89.6494
},
"lat": "39.7998"
}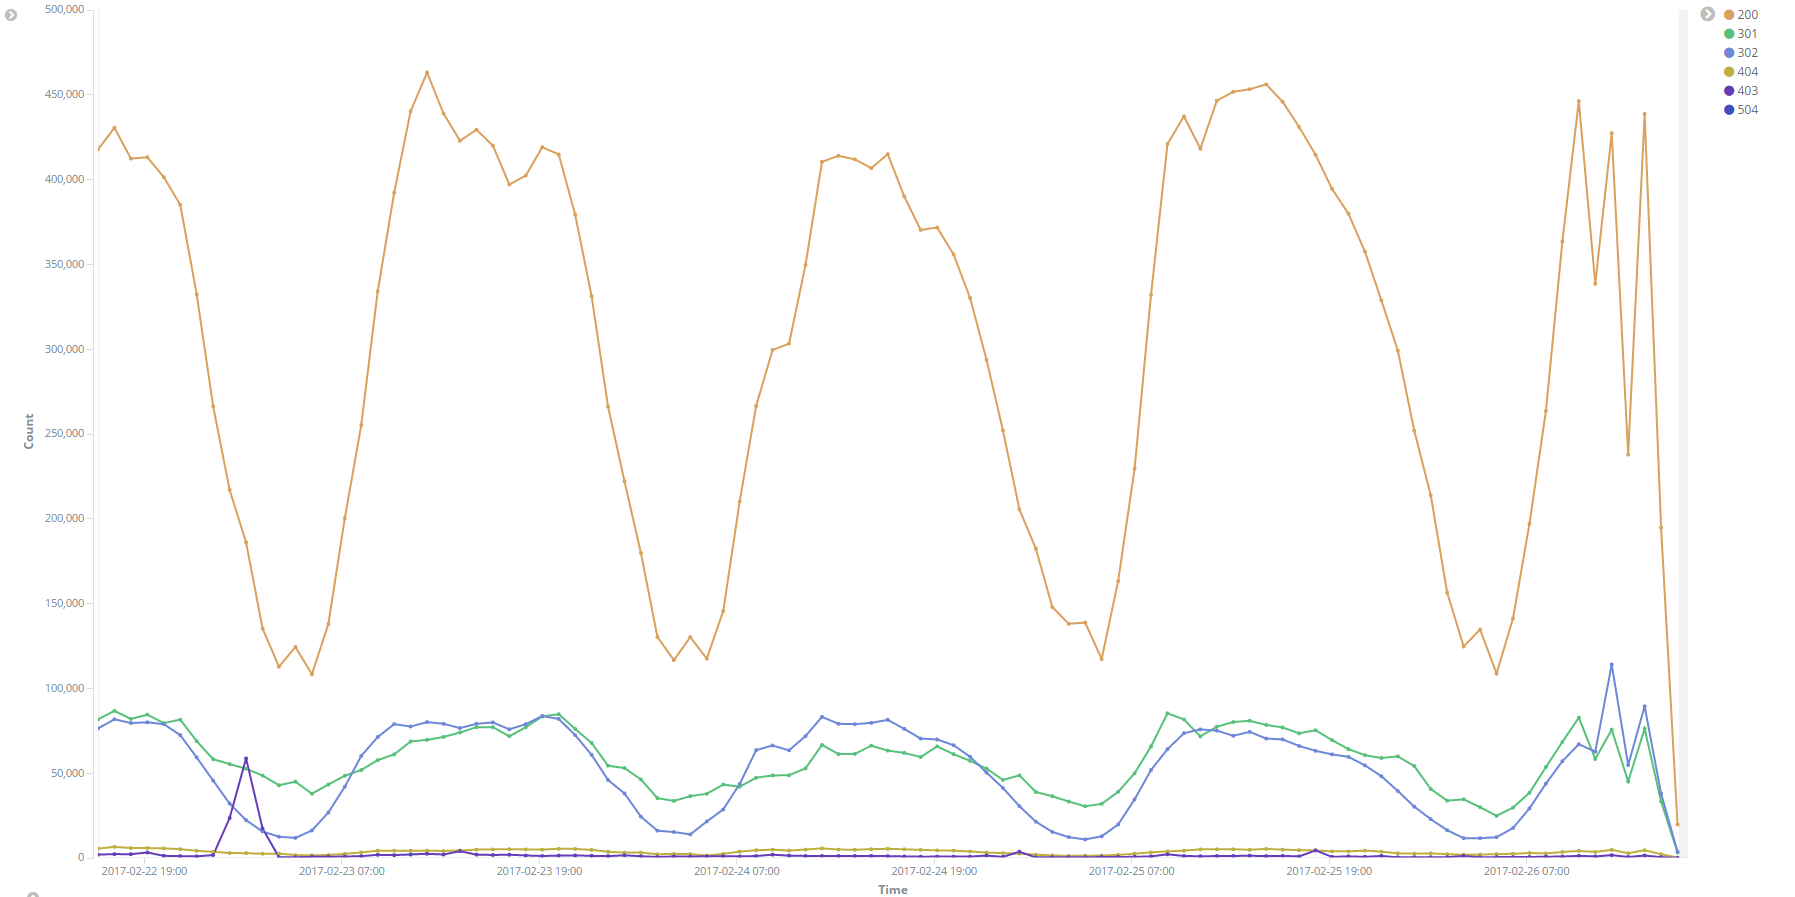 Image: HTTP Response codes over time
In my last post on Apache Avro, I hinted at additional use cases for Avro serialzed data. In this post, I’d like to walk through serializing my data to an Apache Kafka topic. For anyone who is not familiar with it yet, Apache Kafka is a high throughput, distributed, partitioned messaging system. Data is published to Kafka topics where it will become available for consumption by any number of consumers subscribing to the topic.
<?xml version="1.0" encoding="utf-8"?>
<package xmlns="http://schemas.microsoft.com/packaging/2012/06/nuspec.xsd">
    <metadata>
        <id>Microsoft.Kafkanet</id>
        <version>0.0.58.1</version>
        <title>KafkaNet.Library</title>
        <authors>Microsoft</authors>
        <projectUrl>https://github.com/Microsoft/Kafkanet</projectUrl>
        <iconUrl>https://kafka.apache.org/images/kafka_logo.png</iconUrl>
        <requireLicenseAcceptance>false</requireLicenseAcceptance>
        <description>Build of Microsoft Kafkanet solution https://github.com/Microsoft/Kafkanet</description>
        <dependencies>
            <group targetFramework=".NETFramework4.5">
                <dependency id="ZooKeeper.Net" version="3.4.6.2" />
            </group>
        </dependencies>
    </metadata>
    <files>
        <file src="lib\KafkaNET.Library.dll" target="lib\KafkaNET.Library.dll" />
    </files>
</package>//Connect to Kafka instance
var brokerConfig = new BrokerConfiguration()
{
BrokerId = 0,
Host = "kafka-dev-instance",
Port = 9092
}
var config = new ProducerConfiguration(new List<BrokerConfiguration> { brokerConfig });
//Create Avro serialized stream
var stream = new MemoryStream();
Encoder encoder = new Avro.IO.BinaryEncoder(stream);
var writer =
new Avro.Specific.SpecificWriter<Error>(new SpecificDefaultWriter(error.Schema));
writer.Write(error, encoder);
//Publish to Kafka
var msg = new Kafka.Client.Messages.Message(stream.ToArray());
var producerData =
new ProducerData<string, Kafka.Client.Messages.Message>("kafka-topicname", timestamp.value.ToString(), msg);
using (var producer = new Producer<string, Kafka.Client.Messages.Message>(config))
{
producer.Send(producerData);
} Recently, I had an opportunity to work a very interesting prototype using Apache Avro and Apache Kafka. For those of you who haven’t worked with it yet, Avro is a data serialization system that allows for rich data structures and promises an easy integration for use in many languages. Avro requires a schema to define the data being serialized. In other words, metadata about the data that is being serialized. If it helps, think of the Avro schema being akin to an XSD document for XML. Avro does, in fact, have a C# library and code gen tools for generating POCOs from avro schema files. Unfortunately, not a whole lot of documentation exists for either. It took a quite a bit of trial and error to get my serialization logic nailed down. Hopefully this post will help others get started using Avro a lot more easily than I was able to..
{
  "type": "record",
  "name": "Error",
  "namespace": "com.shanidgafur.error",
  "doc": "This is an error record for my application",
  "fields": [
    {
      "name": "id",
      "doc": "System-generated numeric ID",
      "type": "int"
    },
    {
      "name": "appname",
      "doc": "The name of the application generating the error",
      "type": "string"
    },
	{
      "name": "details",
      "doc": "Details of the error",
      "type": "com.shanidgafur.error.ErrorDetails"
    }
  ]
}{
"type": "record",
"name": "ErrorDetails",
"namespace": "com.shanidgafur.error",
"doc": "This is an error details record",
"fields": [
{
"name": "category",
"doc": "Category of the error. Eg: DatabaseConnectionError",
"type": "string"
},
{
"name": "severity",
"doc": "The severity of the error. Eg: CRITICAL, FATAL, WARNING",
"type": "string"
},
{
"name": "timestamp",
"doc": "Timestamp (UNIX epoch) of error",
"type": "long"
}
]
}packages\Apache.Avro.Tools.1.7.7.4\lib folder. I tried a number of different ways to get the code generation to work across multiple schema files, but did not have a whole lot of success getting the utility to work.
In the end, I had to copy avrogen.exe, Avro.dll (from the Avro package lib directory) and Newtonsoft.Json.dll into a folder along with the avsc file to get this to work. Additionally, I have to merge the two schema types into a single file. A bit of cop out, I’ll admit, and one of these days I plan to get back to figuring out if there is a better way to do this.
In the end, this is what my merged schema file looked like
{
	"namespace": "com.shanidgafur",
	"type":[
		{
		  "type": "record",
		  "name": "ErrorDetails",
		  "namespace": "com.shanidgafur.error",
		  "doc": "This is an error details record",
		  "fields": [
			{
			  "name": "category",
			  "doc": "Category of the error. Eg: DatabaseConnectionError",
			  "type": "string"
			},
			{
			  "name": "severity",
			  "doc": "The severity of the error. Eg: FATAL, WARNING",
			  "type": "string"
			},
			{
			  "name": "timestamp",
			  "doc": "Timestamp (UNIX epoch) of error",
			  "type": "long"
			}
		  ]
		},
		{
		  "type": "record",
		  "name": "Error",
		  "namespace": "com.shanidgafur.error",
		  "doc": "This is an error record for my application",
		  "fields": [
			{
			  "name": "id",
			  "doc": "System-generated numeric ID",
			  "type": "int"
			},
			{
			  "name": "appname",
			  "doc": "The name of the application generating the error",
			  "type": "string"
			},
			{
			  "name": "details",
			  "doc": "The name of the application generating the error",
			  "type": "com.shanidgafur.error.ErrorDetails"
			}
		  ]
		}
	]
}avrogen.exe -s Error-Merged.avsc .
This generates two .cs files that I then just pulled into my solution.
//Calculate Epoch Timestamp

DateTime EpochBeginDate = new DateTime(1970, 1, 1);
long CurrentTimestamp =
	(long)(DateTime.Now.ToUniversalTime() - EpochBeginDate.ToUniversalTime()).TotalSeconds;

//Populate the code generated Avro POCOs with data to be serialized

ErrorDetails details = new ErrorDetails
{
	Category = "DBConnectivity",
	Severity = "FATAL",
	Timestamp = CurrentTimestamp
};
Error apperror = new Error
{
	Details = details,
	Appname = "MyApplication",
	Id = 123
};

//Setup File Stream for serialization

string filelocation = @"c:\temp\avro.bin";
var stream = new FileStream(filelocation,
				FileMode.OpenOrCreate,
				FileAccess.ReadWrite,
				FileShare.Write);

//Endode the stream and write to file system

Avro.IO.Encoder encoder = new BinaryEncoder(stream);
SpecificDefaultWriter writer = new Avro.Specific.SpecificDefaultWriter(apperror.Schema);
writer.Write<Error>(apperror, encoder);
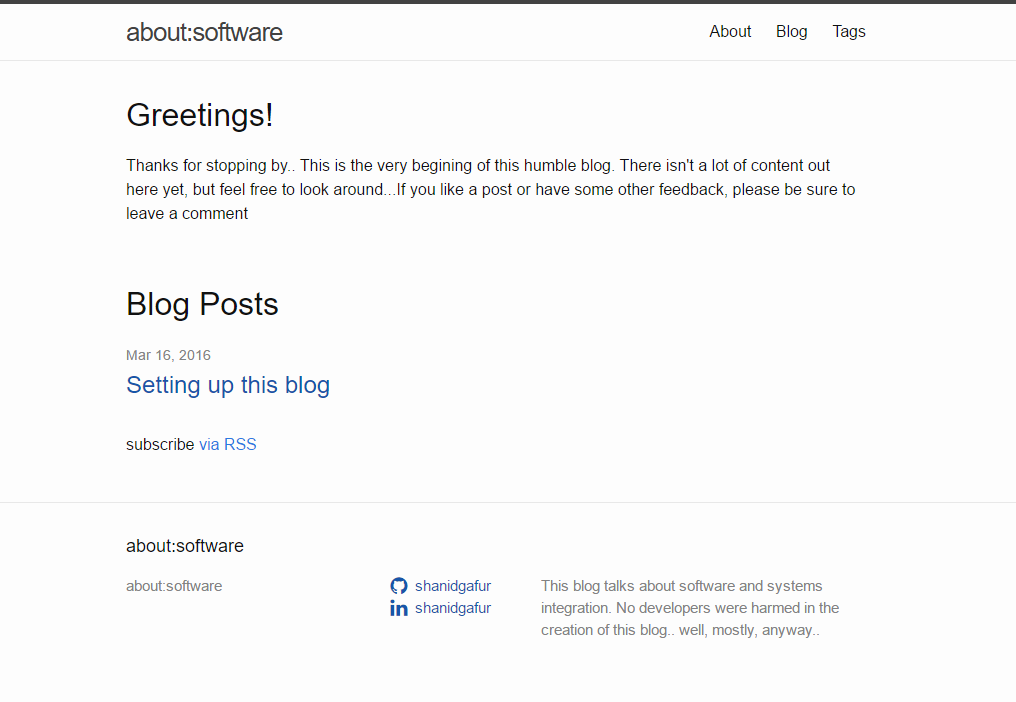
stream.Close();Since setting up this blog, I’ve been tweaking away little things to make them ever so slightly better. Integrating web analytics, diqus comments integration etc etc. One of the things that I’ve been meaning to do but did not get really get around to was changing the look and feel of the default jekyll site.
 Knowing me, I’m probably not even close to done tinkering with this site. Continuing to enjoy jekyll and the ecosystem of plugins, themes etc that are supported. Have a suggestion for tweaking things further? A plugin that you’d like to recommend, perhaps? Add a note in the comments section below…
…
Knowing me, I’m probably not even close to done tinkering with this site. Continuing to enjoy jekyll and the ecosystem of plugins, themes etc that are supported. Have a suggestion for tweaking things further? A plugin that you’d like to recommend, perhaps? Add a note in the comments section below…
…
Since this is the very first post on this blog, and I am not sure how many posts will follow this one, I’ve decided to start off by just explaining how this blog has been setup and how you, too, can have your very own shiny new blog on github pages. For what it’s worth, I’ve discovered there’s quite a few blog posts out there that talk through all of the steps outlined below, in quite a bit more detail. You can consider this the TL;DR version of those posts.
PS:\>iex ((new-object net.webclient).DownloadString('https://chocolatey.org/install.ps1'))
choco install ruby -y
gem install jekyll
jekyll new myblog
What this will do will create a folder structure similar to the below
.
├── _config.yml
├── _drafts
|   └── this-is-a-draft.markdown
├── _includes
|   ├── footer.html
|   └── header.html
├── _layouts
|   ├── default.html
|   └── post.html
├── _posts
|   └── 2016-03-01-this-is-a-post.markdown
├── _site
├── .jekyll-metadata
└── index.htmljekyll serve
This will start off a running instance of the generated html for the site, and you will be able to see this at http://localhost:4000/
To see draft posts
jekyll serve --drafts
At a high level, the _layouts folder contains (as expected) the overall layouts of the site. The layouts themselves are mostly html with a bit of liquid tags mixed in. Layouts themselves mostly serve as placeholders for html includes that exist in the _includes folder. With these two building blocks in place, changing the look and feel of the site boils down to one of two things
---
layout: post
title: "Setting up this blog"
summary: This post talks about the process followed to setup a blog on github pages using jekyll
tags: [jekyll,blogging,github pages, discus]
---
_drafts folder and review the page using the jekyll serve --drafts command mentioned above.
Once you’re good with the way the page looks, you can copy the draft to the _posts folder. Remember that posts need to use the following naming convention YEAR-MONTH-DAY-title.MARKUP
jekyll build --destination <destination>
Check the output of the build to the repo for github page, and voila you’re done!
Hopefully this guide helps you along as your way as you attempt to start your own experiments with Jekyll. If you’ve found this useful or have some additional tips for jekyll users, please leave me a comment or hit me up on twitter.
Cheers!
…
subscribe via RSS